In our second article in our series on the TM1 SDK we dive into TM1 REST API.
In our first post introducing this series on the TM1 SDK, we provided some background on what is the TM1 SDK and why we think it’s worth learning about, even if you aren’t sure if you’d ever need to use it. Since it’s officially summer here, we thought for the second article in our series on the TM1 SDK we’d throw you into the deep end of the pool with one of the most significant TM1 SDK components: the TM1 REST API.
If you think you won’t be able to swim, don’t worry: we’ll make sure you stay afloat with a handy, free application called Postman. We’ll show you how to use Postman to do the same kinds of things you might do today with TM1TOP or Operations Console, but using the TM1 REST API with NO programming.
This post will walk you through the following:
- TM1 Server environment prerequisites
- What is Postman and how do I use it with the TM1 REST API?
- Using Postman to view user activity on a TM1 server
- User process filter & sort options
- Cancel a running user process
- Recap & next steps
TM1 Server environment prerequisites
Before you go any further, there are a few important things you’ll need to get ready. First, please use a TM1 development environment, initially; it never pays to play in production! Other TM1 environment requirements and related prerequisites follow:
On-premise TM1 Server
- TM1 Server 10.2.2 with FP5, or later; this can be 32 or 64-bit on any IBM-supported platform
- Configuration (TM1S.CFG):
- Configure TM1 to run in Native TM1 security mode (IntegratedSecurityMode=1 or 2); the REST API does support all TM1 security modes, but this walkthrough uses native logins
- Specify (and take note of) a valid port number in the HTTPPortNumber configuration setting
- Check whether or not you are using SSL, via the UseSSL configuration setting
Planning Analytics Cloud / TM1 Cloud Server
- Access to a TM1 instance in your Planning Analytics cloud development environment and access to the documentation provided by IBM when your environment was provisioned, if possible
TM1 Credentials
- In order to view TM1TOP-like thread information using the REST API you will need credentials for a TM1 user with ADMIN or SecurityAdmin group membership. You can try this with DataAdmin or non-admin users, but you’ll only ever be able to see yourself!
What is Postman and how do I use it with the TM1 REST API?
The TM1 REST API is based on modern, widely-adopted web standards; one of the benefits of this is that there are many tools, some of which are free, that can be used to test and work with the REST API. One free tool that we find useful to get exposed to the REST API and its capabilities is something called Postman, which is a free Google Chrome App (also available for the Mac) that you can find here: https://www.getpostman.com/
NOTE: all screenshots we will show are based on the Chrome App in Microsoft Windows.
Postman makes it easy to test out REST API calls with no programming required, and also provides a ways to save, reuse and share those calls with others. Postman is capable of issuing ANY REST API command.
After installing Postman into the Chrome browser or the Chrome Desktop App launcher, look for the Chrome Apps icon ( ) to show all installed Chrome Apps. Click on the Postman icon and get ready to use the TM1 REST API!
The Postman interface may look a little intimidating, but we’ll walk you through the parts of it that matter when communicating with a TM1 server:

Next, let’s get ourselves set up to start making REST API calls with Postman.
Setting Environment Variables with Postman
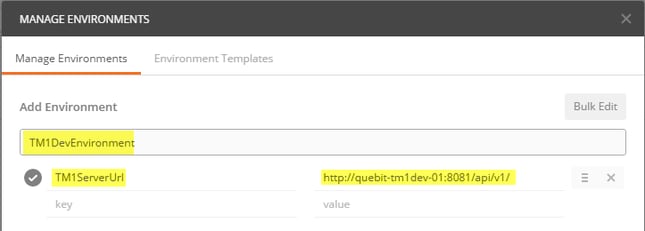
Postman provides an Environment feature, accessed via the drop down marked #1 in the screenshot of the Postman interface, which we like to use as a handy way to store information about one or more TM1 environments that we plan to connect to. In our example, we’re going to create an Environment setting for the location of the TM1 development server that we plan to connect to using the REST API.
To add a new TM1 environment, click on the Environment drop down (which says “No environment”, initially) and select “Manage Environments”. Once the Manage Environments form opens, click the “Add” button. We will name our environment “TM1DevEnvironment” and add a new variable called “TM1ServerUrl” (in the “key” field) and the full REST API Url of our TM1 server (in the “value”) field:

Click the Add button when you are finished in order to save these changes. We’ll be able to use this environment and TM1ServerUrl variable as a shortcut when specifying Urls to issue REST API commands to a TM1 server. To select and use a specific environment now and in the future, choose the environment name from the drop down.
You can determine the correct Url for your own TM1 server to communicate via the REST API as follows:
On-Premise TM1 Server
If you are not an IBM Cognos TM1 Cloud customer, you can determine the Url to access the REST API largely from your TM1S.CFG. In order to piece this together, you will need to know the address of your TM1 server (machine name, IP address or Url), and your HTTPPortNumber and UseSSL settings.
Some examples:
- TM1 server running on a machine called “development-tm1-01” with an HTTP port number of 8090 and UseSSL = F:
http://development-tm1-01:8090/api/v1/
- TM1 server running on a machine at IP address 10.140.125 with an HTTP port number setting of 5901 and UseSSL = T:
https://10.1.140.125:5901/api/v1/
Planning Analytics Cloud / TM1 Cloud Server
The Url used when accessing the REST API as an IBM Cognos TM1 Cloud customer is a little different. IBM provides a simplified Url to access the REST API, and you must know both the Url of your TM1 Cloud server as well as the name of the TM1 server instance to which you plan to connect. This Url looks something like the following, if your TM1 server instance is called “Planning Sample” and the location of your TM1 Cloud server is at “myserver.planning-analytics.ibmcloud.com”:
https://myserver.planning-analytics.ibmcloud.com/tm1/api/Planning Sample/api/v1/
Setting TM1 Login Credentials & Headers
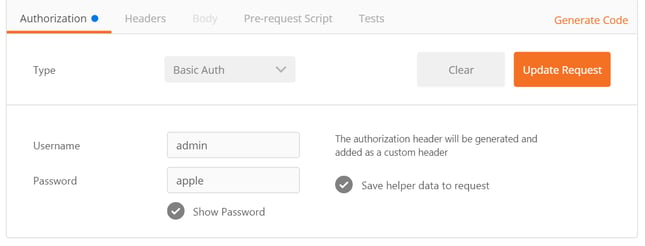
Now that we have specified the location of our TM1 server by adding and then selecting it from the Environment drop-down we will need to enter in some information that will be used to login to our TM1 server. Beginning with the “Authorization” tab (marked #2 in the screenshot of the Postman interface), select “Basic Auth”; this indicates we’ll be using native TM1 login credentials. Next, enter in a TM1 user id and password and click Update Request when you are finished:

Remember that you’ll only be able to see other user threads if you login as a TM1 ADMIN or SecurityAdmin group member.
Click on the “Headers” tab and you will see that your login credentials have been transformed into a header that the REST API will understand. We need to add one more header before we can start making REST API calls:
|
Key |
Value |
|
Content-Type |
application/json; charset=utf-8 |
When you are finished, you should see something similar to this, reflecting the login information (Authorization) and content-type headers that we will need:

TIP: You can optionally save these headers for easy retrieval later like you did for the Environment. To do that, select “Manage presets” from using the “Presets” drop-down and give your login and header information a name. In future Postman sessions you can select that Presets name to reload these headers without needing to enter login credentials and other headers again.
Are you ready to start talking to your TM1 server? Next we’ll see what threads (user and system processes) are running on our TM1 server!
Using Postman to view user activity
Now that we have all of the required configuration information ready to go, including login credentials, we can issue a very simple command to return all threads on our TM1 server. To do this, enter the following into the request box that says “Enter request URL” (marked #2 in the screenshot of the Postman interface):
Threads
The refers to the environment variable we created previously, indicating where our TM1 server is listening for REST API calls. Threads is what we are requesting: in this case we want to return all open threads (active or not) on the TM1 server. If you click the “Send” button and everything was configured properly, you’ll see an additional section of Postman populated with the response from TM1 and a Status of “200 OK”.
If your login credentials were incorrect you may see a “401 Unauthorized” status. We won’t go into all of the possible status response status codes here, but you can find out more information on them in OData documentation and in the Troubleshooting topic on the IBM TM1 SDK DeveloperWorks site Wiki.
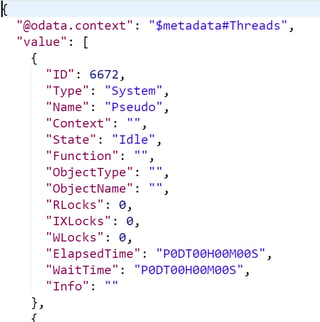
Believe it or not, what was just returned by TM1 is exactly the same information that TM1TOP would show you, but in a human-readable, text-based format that the REST API uses to exchange data called JSON:

We won’t go into the details of what is JSON in this article, but if you’re familiar with TM1TOP and some of its thread status codes, you will see the same information about each TM1 server thread, all framed within curly braces {}. The fields TM1TOP users are probably most familiar with are things like ID (needed to cancel a thread), Name (what user), State, Function (what is the user doing), ElapsedTime (for running threads), and WaitTime (for waiting threads).
TM1 REST API - Filter & Sort Options
Although it’s exciting that we can quickly retrieve all threads on our TM1 server, we don’t necessarily need to retrieve all field information for every thread, nor do we always need to see every “Idle” thread on the server.
Fortunately, there are some quick and easy ways to modify our request using filtering and sorting options (part of the OData 4.0 standard that TM1 supports) available in the TM1 REST API. If you’re familiar with relational databases and the SQL language, this might seem familiar. Let’s look at a few of these options.
Returning non-Idle Threads
If we want to look at active user threads, the first thing we will do is to filter out all threads that are marked as “Idle”. We do this by adding the $filter parameter in our command:
Threads?$filter=State ne 'Idle'
Sending this request will return your own thread (since you just made a request) as well as any others that are currently in a non-Idle state on the TM1 server.
Filtering Specific Thread Data
But, what if we want to narrow down the amount of data being returned for each thread to only focus on the fields we are interested in? We do this by adding a $select parameter in our command to specify the fields we want to see:
Threads?$select=ID,Type,Name,Context,State,Function,ElapsedTime,WaitTime,Info&$filter=State ne 'Idle'
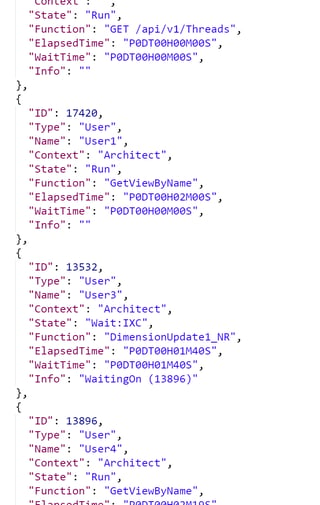
Sending this request will retrieve only the requested fields. At this point you should see something like this (our example has several running threads, including one in a “Wait” state):

Sorting Thread Data
Suppose we want to see the same information, but in a certain sort order. We can add the $orderby parameter in our command to indicate we would like to sort by the State and Wait Time:
Threads?$select=ID,Type,Name,Context,State,Function,ElapsedTime,WaitTime,Info&$filter=State ne 'Idle'&$orderby=State,WaitTime desc
Sending this request will return information that is identical to the prior example, but separates the different statuses and sorts waiting threads by ascending wait time.
Note about Elapsed Time and Wait Time values: these values are encoded in a string that specifies the elapsed or wait time in days, hours, minutes and seconds. For example, a value of “P1DT12H31M15S” would mean an elapsed or wait time of: 1 day, 12 hours, 31 minutes and 15 seconds.
Getting a Count of Waiting Threads
Finally, what if we simply want a quick glance at the number of waiting threads, since that could indicate a potentially long-running process tying up our server. we can use the $count parameter with a slightly modified $filter parameter, returning the number of threads that are in a Wait state (any state starting with “Wait”):
Threads/$count?$filter=startswith(State,'Wait') eq true
This will return the number of threads in some form of a wait state (“0” if there are no waiting threads). If you want to cancel a thread that is causing another thread to “Wait”, please continue onto the next section. Yes, you can even cancel a thread from Postman!
Cancel a running user process
In our “Filtering Specific Thread Data” and other examples above we saw that the TM1 REST API returns information about which Run thread another thread is Waiting on:

That ID, like in TM1TOP, is what we need to know in order to attempt to cancel a thread. Canceling a thread with Postman and the TM1 REST API is a little different from the prior examples in that we need to tell the TM1 server to perform an action. You may have noticed the drop-down in Postman that says “GET”, which indicates to TM1 that we are asking for it to get and return data to us—in order to cancel a thread we need to POST a command, by selecting “POST” from that same drop-down and issuing this command:
Threads/(<Thread ID to Cancel>)/tm1.CancelOperation
Sending that command with our thread ID “13896” will return a “204 No Content” message if the call completed:

As is the case with TM1TOP and Operations Console, not all running threads may be canceled.
Combining Postman and the TM1 Rest API
The combination of Postman and the TM1 REST API is by no means a superior alternative to TM1TOP or Operations Console. Postman does, however, provide a simple interface that makes it easy to quickly experiment with the REST API and its capabilities.
Another nice thing about Postman is that automatically keeps a running history of REST API calls that you’ve made, which means you can easily go back and find previous, unsaved calls. It also has options for saving, sharing and reusing named REST API calls in libraries/collections (the area marked #4 in the screenshot of the Postman interface).
This means you could create a simple libraries or “dashboards” of commands to, using some of the examples in this article, periodically check the health of your TM1 server based on exactly what you want to see:

If you visit the IBM Documentation and the active TM1 SDK community on IBM DeveloperWorks, you will find other examples and documentation covering the things that you can do with the REST API.
In the next article in this series on the TM1 SDK we’ll take a look at how the TM1 REST API performs compared to legacy TM1 APIs, including over internet & wide area network connections, and provide tips on how to get more efficient use from the REST API without overburdening your TM1 server.