Welcome back to our PAW Pro Tips blog series. In the previous blog, we looked at how to create interactive map visualizations in PAW. In this blog, we’ll show you how to use PAW calculations directly in the workspace, without writing any code.
The ability to create custom calculations in PAW is extremely useful and not available in Perspectives or TM1Web – one more reason to upgrade to Planning Analytics 2.0 and start working with PAW! PAW calculations allow end-users to create their own calculations on the fly, without needing to write business rules or rely on Excel. Note that PAW calculations do not replace business rules for more complex modeling calculations.
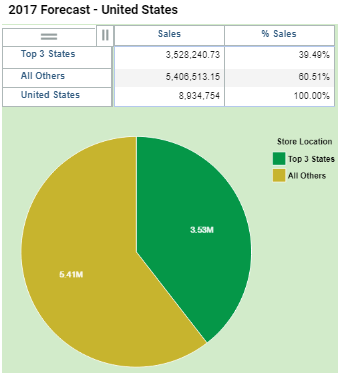
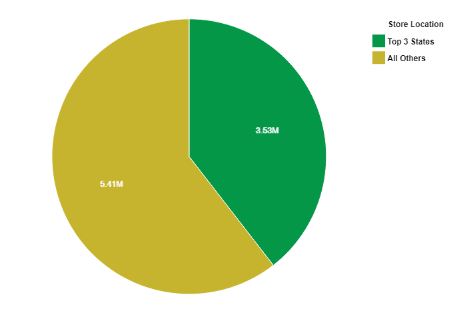
To demonstrate the power of PAW calculations, we’ll create a pie chart comparing Forecasted US Sales for the Top 3 States against All Other States, as shown below.
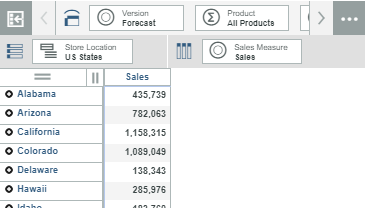
We’ll start with the view below, showing Forecasted Sales by US State.
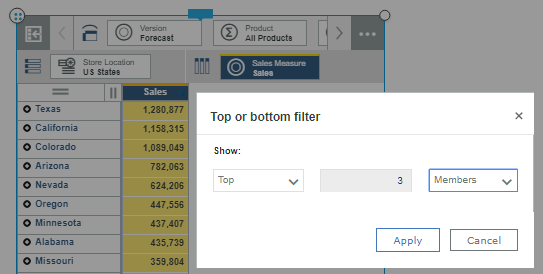
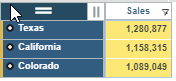
Next, we’ll filter the view to show only the Top 3 States right-clicking the Sales column, selecting “Top or bottom filter,” and filtering for the Top 3 Members.
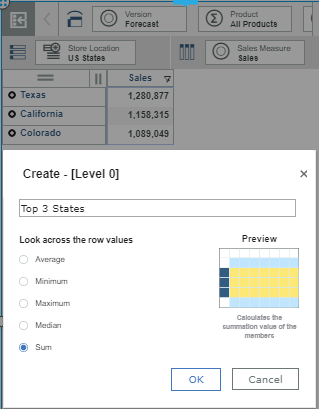
Next, we’ll create a PAW calculation to summarize the Top 3 states by clicking the two horizontal lines above the row set to select all elements, right-clicking any of the element (state) names, and then selecting “Create calculation.”
We’ll name our calculation “Top 3 States,” select the “Sum” option and click OK.
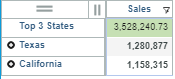
Note that the filtered Exploration now only shows the Top 2 States and our new “Top 3 States” element, but that doesn’t matter as we are going to change the elements in the row subset anyway.
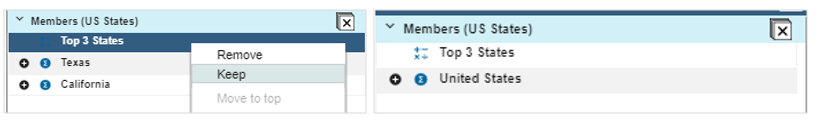
Next, we’ll open the subset editor for the Store Location dimension, Keep the new calculated element (or remove the other elements), add the “United States” rollup to the subset, and click “Apply and Close.”
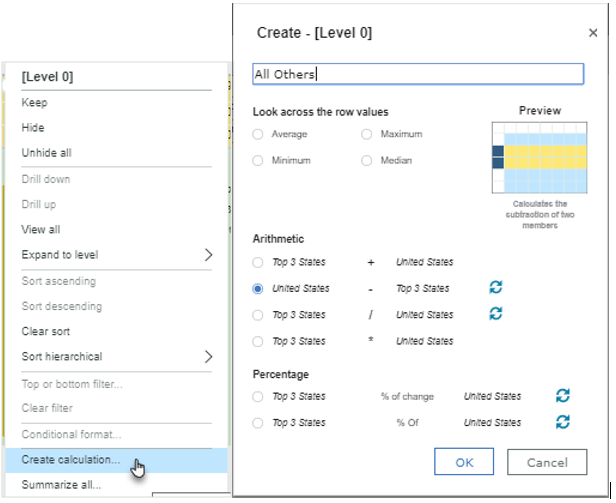
We’ll add another calculation in the row set, subtracting the “Top 3 States” from “United States,” to get the value for “All Other.” As we did previously, we’ll click the two horizontal lines above the row set to select all elements, right-click any of the elements, and select “Create calculation.”
We’ll name our calculation “All Others,” and select “Top 3 States – United States”, then click the icon to invert the calculation to “United Stated – Top 3 States.”
The pie chart visualization in PAW requires that either a row or column dimension is present in the view, but not both. To create our pie chart, we’ll drag the Sales Measure dimension up to the context area, which will clear the data from our exploration but will make the pie visualization available.
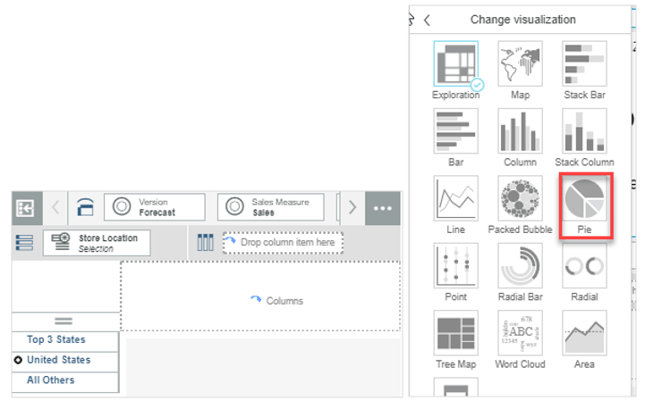
Making this selection will give us our pie chart.
As far as I can tell at this point, pie charts in PAW cannot be configured to show percent values on the chart. One workaround is to add another calculated column to our original exploration to show the percent of Sales. To accomplish this, we can right-click the Sales element in our exploration and select “Create calculation.”
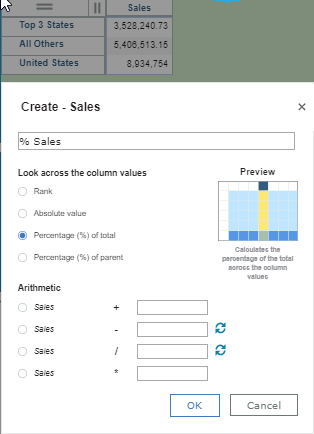
We’ll call this calculation “% Sales,” select the “Percentage (%) of total” option, and click OK. Combining the exploration and the pie chart on our workspace allows us to see the percentage values and pie visualization together.

To learn more about how to use PAW like a pro, please join us for our upcoming PAW Pro Tips webinar on December 14th, and stay tuned for more tips in this blog series!