
ReportWORQ makes the job of TM1 report distribution easy! It automates the creation and distribution of your existing TM1 Perspectives and Xcelerator Excel reports.
But did you know that ReportWORQ can successfully pull data from MULTIPLE servers into one output?
A few important set up options to note:
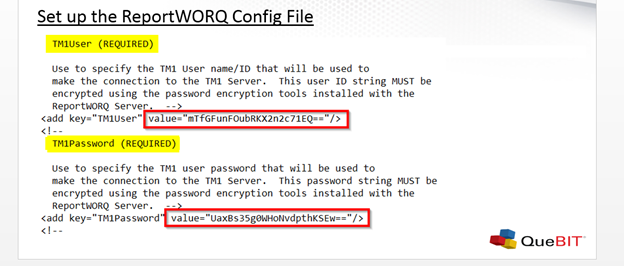
- Both servers must have the same username and password. This is defined in the ReportWORQ config file under the sections "TM1 User" and "TM1 Password." The user name and password values have to be encrypted using the encryption utility.
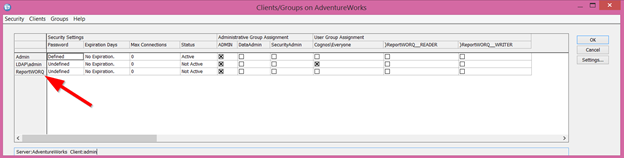
- On the second server, be sure to add a new client named "ReportWORQ."
-
When running the job via the TI, you must enter the servers separated by a semi-colon.
For example: ServerName1; ServerName2
-
ServerName1 must be the lead server with all the ReportWORQ jobs and parameter settings.
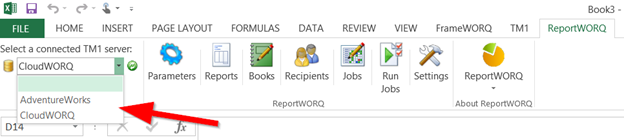
For example: I created my parameters, reports and jobs in my local CloudWORQ server. I then created a report that pulled data from both the CloudWORQ server and my local AdventureWorks. Therefore, I must enter my server names in the following order:
-
If you were to enter the reverse order of the servers, you would get an email message with the following error message:
"Job Dual Server Pull failed because: Error: Job Dual Server Pull not found."
It makes sense that the job failed since the process is looking for the job within the lead server (here, AdventureWorks) and doesn't see it (because it's in CloudWORQ).
-
Pulling data from two servers into one generated output works when running the job via the client and the server.
When running the job from the server, you don't have to be logged into both servers in order for the output to generate and the data to pull from both servers. You must be logged into the lead server (here, CloudWORQ) to run the process successfully and still generate output that pulled from the second server.
When running the job from the client, you must be logged into both servers. ReportWORQ must be able to see both servers. You can validate this by clicking on the server drop down list on the ReportWORQ server. Be sure you are connected to the lead server and "Run Job" as normal.
-
When entering the information to run the job via the server, server and job names are case sensitive. Watch your spelling!
Let's walk through the creation of an example report output.
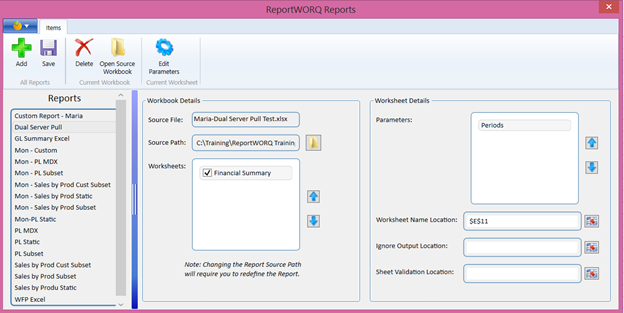
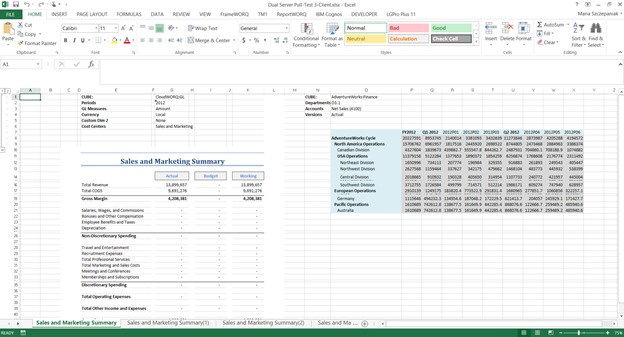
First create your report parameters. At least one dimension must be shared between the two cubes in which we are pulling data. For this example, I wanted "Periods" to be the shared dimension and set it up as a subset.
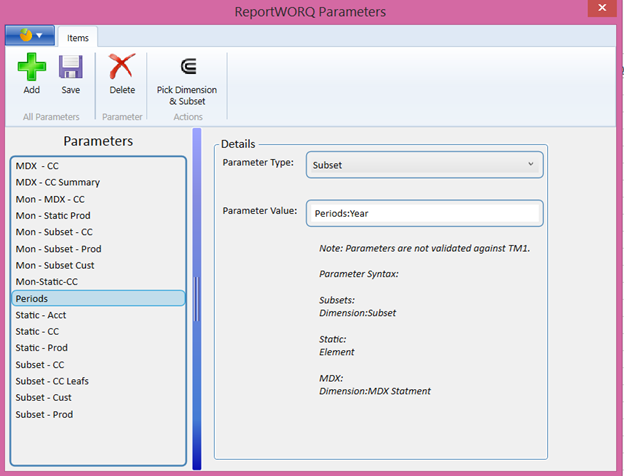
The left side of the report pulled data from the CloudWORQ server. The right side of the report pulled data from the ReportWORQ server.
Second, create a new report. As usual, be sure to define the source file path, select the desired source file, select the desired worksheets, add parameters and define the worksheet's name location (remember, this is the title of the report).
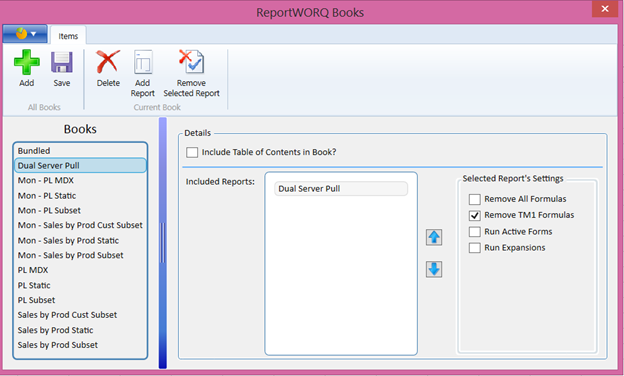
Third, create a new book. As usual, add a report and select whether to include a Table of Contents, remove formulas or run any active forms and expansions.
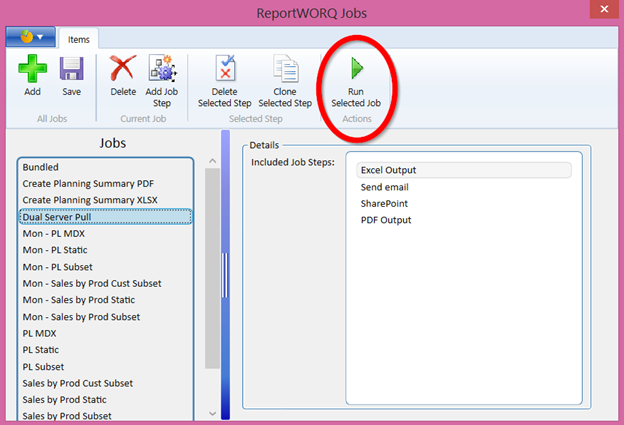
Fourth, create a new job.
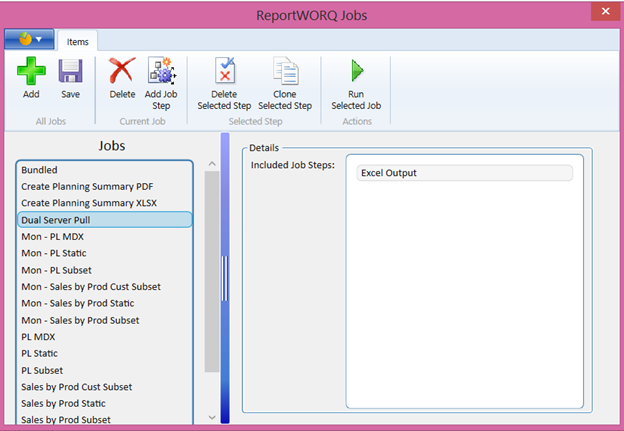
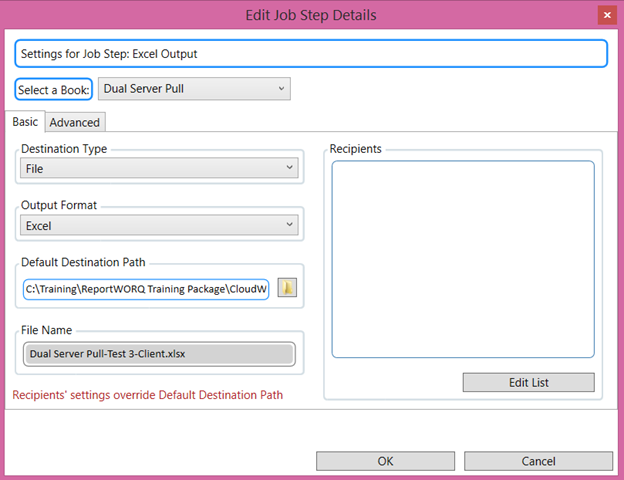
Fifth, create a new job step. As usual, edit the job step details by selecting a book, defining whether the output will be a PDF or Excel file, saved to SharePoint or generate email. Be sure to select a destination path and name the file. Defining recipients and spawning files are optional but not required.
Sixth, run the job.
Lastly, analyze the output. I verified that my output report sent to desired recipients via email, posted to SharePoint and I also saved the report in a specific folder in both an Excel and PDF format.
Let's open the Excel report and analyze the data being pulled from the two servers. In the screen shot below, you will see data pulled into my report on both the left and the right. Because I created my "Periods" parameter to be a subset, ReportWORQ cycled through all years and generated a tab for each year in the subset.
Congratulations! We correctly set up ReportWORQ so that it pulled data from two servers into one output report!
ReportWORQ takes the rich business analytics data you've already collected in TM1 and automatically distributed it in meaningful reports to users across the enterprise to drive successful business decisions.
Interested in learning more about ReportWORQ? Sign up for a Free 90-day evaluation today! www.quebit.com/rw