The term ad-hoc report development has long been part of the analytics lexicon, dare I say a buzzword. The idea of self-service analytics has been a clarion call for many of the major analytics providers - create tools and environments that empower the business users to develop their own analytics, with little or no support from IT required. This self-fulfilling prophecy has never fully materialized, and has only been relevant on the report development side of the analytics functions spectrum.
With the release of Cognos Analytics, we see the first true approach to ad-hoc model development. The addition of the new Data Module functionality provides individual users with the ability to easily bring in external data and map it to an existing enterprise data package to create hybrid, custom data sets.
Users can select and modify multiple sources, merge data, cleanse data, and derive new data to create new custom data sets. The external data can be flat files that live on-premise or somewhere in the cloud. The new custom data sets can be used for an individual’s own analytic needs and/or can be shared with others across an organization.
The idea of allowing users to bring in external data to create custom sets is not in itself new, it has been around since Cognos BI 10.1.1. What was previously a multi-step, multi-tool process, more reminiscent of a technical/data modeler function, has been streamlined, simplified, and modernized, providing users with ad-hoc data modeling capabilities within the single Cognos Analytics integrated environment.
The new Data Module functionality introduces the concept of intent driven modeling. Users select an enterprise data package and enter a search term (e.g. “product type target”) and Cognos Analytics analyzes the data to make recommendations regarding which tables from the data source to use, then suggests related content in the environment that might be useful for the analysis. This is another example (see Smart Search) of the much improved search functionality within Cognos Analytics.
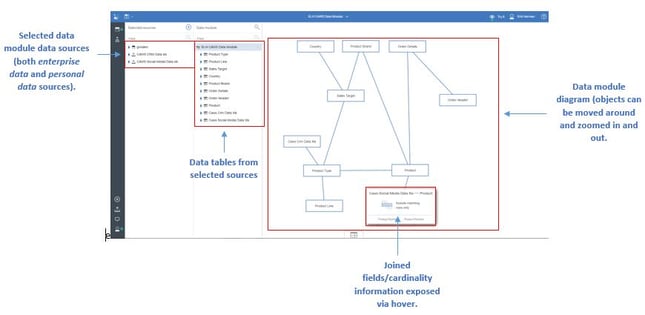
Once tables are selected from the recommendations and added to the data module, Cognos Analytics creates the relationships between the tables. Call me a data nerd, but this is really cool and helpful! Users interact with the tables and relationships using a visual canvas, which is slightly reminiscent of creating modeling streams in SPSS Modeler. Tables can be arranged on the canvas, users can zoom in/zoom out with the mouse wheel, hover over a relationship link to see information about the link (e.g. linked fields, cardinality etc.). Again, you might be a data nerd if you find this cool and fun, which I do!
Users can then select and add additional tables (that may not have been recommended initially) from the data source. Once added to the canvas, Cognos Analytics will evaluate the new tables in relation to the existing data module and again create the relationship joins.
External files that share a common data column with a table in the enterprise data source can be quickly uploaded and joined, and their cardinality set. This is a simple, manual join process done within the integrated Cognos Analytics environment. The use of colors to indicate joins and columns from different tables is helpful.

The new Data Module functionality also allows users do some advanced modeling work. Custom calculations can be easily created and embedded in the new data set (e.g. variance, average etc.). Also, new data variables can be derived on the fly, such as creating custom groups off of an existing column(s). For instance, instead of looking at the individual age(s) of a user(s) record in a data source (e.g. record 1 age = 29, record 2 age = 42 record 3 age = 57 etc.), custom age groupings (record 1 age group = 18-35, record 2 age group = 39-45, record 3 age group = 45-65 etc.) can be created, which may be more useful for a particular analytics requirement.
Users also have the ability to manipulate some of the properties of the data in the data module. For example, by default, Cognos Analytics considers any numeric data brought into the new data module as being numeric, and by default will sum this data, which in the case of something like age or a calculated unit price field, would not be correct. The aggregation method property can be changed.
The final step in the process of creating a data module is to test the new data set. Since this work is being done inside of Cognos Analytics integrated development/consumption environment, users can quickly create a list report, cross-tab, chart etc. to test how the data is being rendered and make changes and/or additions on the fly, and/or simply begin using the data module to create analytics.
As we can see, this new Data Module functionality in Cognos Analytics allows users to very quickly find data using the much improved search functionality, generate a data model with auto generated relationships, join new data, create calculations, derive new variables, test and deploy. It’s yet to be seen how, where, when, and why this functionality gets used in the real-world, but I predict this type of ad-hoc data modeling is to become the norm and an expectation for analytics users here on forward. Analytics professionals five, ten, or fifteen years from now will take all of this for granted, but today it truly represents a brave new world!
Register Now for our upcoming Webinar: Cognos Analytics – It’s a Brave New World! Hosted by: Christina Hasse & Erik Herman on September 8th