The Dashboard tool in Cognos Analytics 11.0.12 now has the capability of drilling-through to reports, enabling integration between dashboards and reports, and thus access to more detailed information from high-level dashboards.
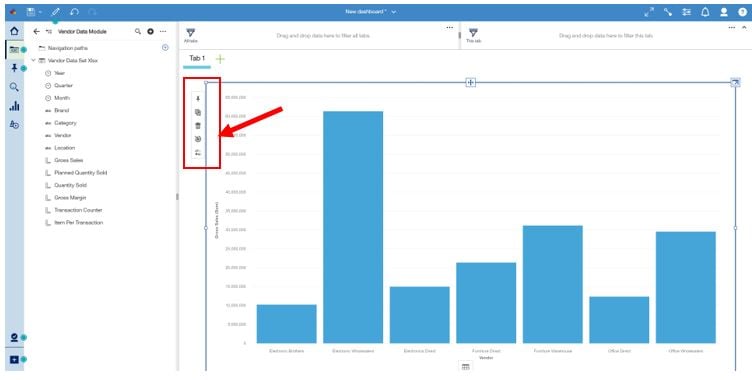
Defining a drill-through in a dashboard is straightforward. Once a visualization has been created, a user can define a drill-through by double-clicking the visualization and selecting the Drill-through icon (![]() ).
).

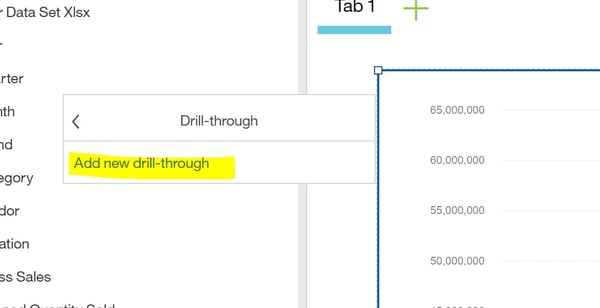
Next, add a new drill-through definition.

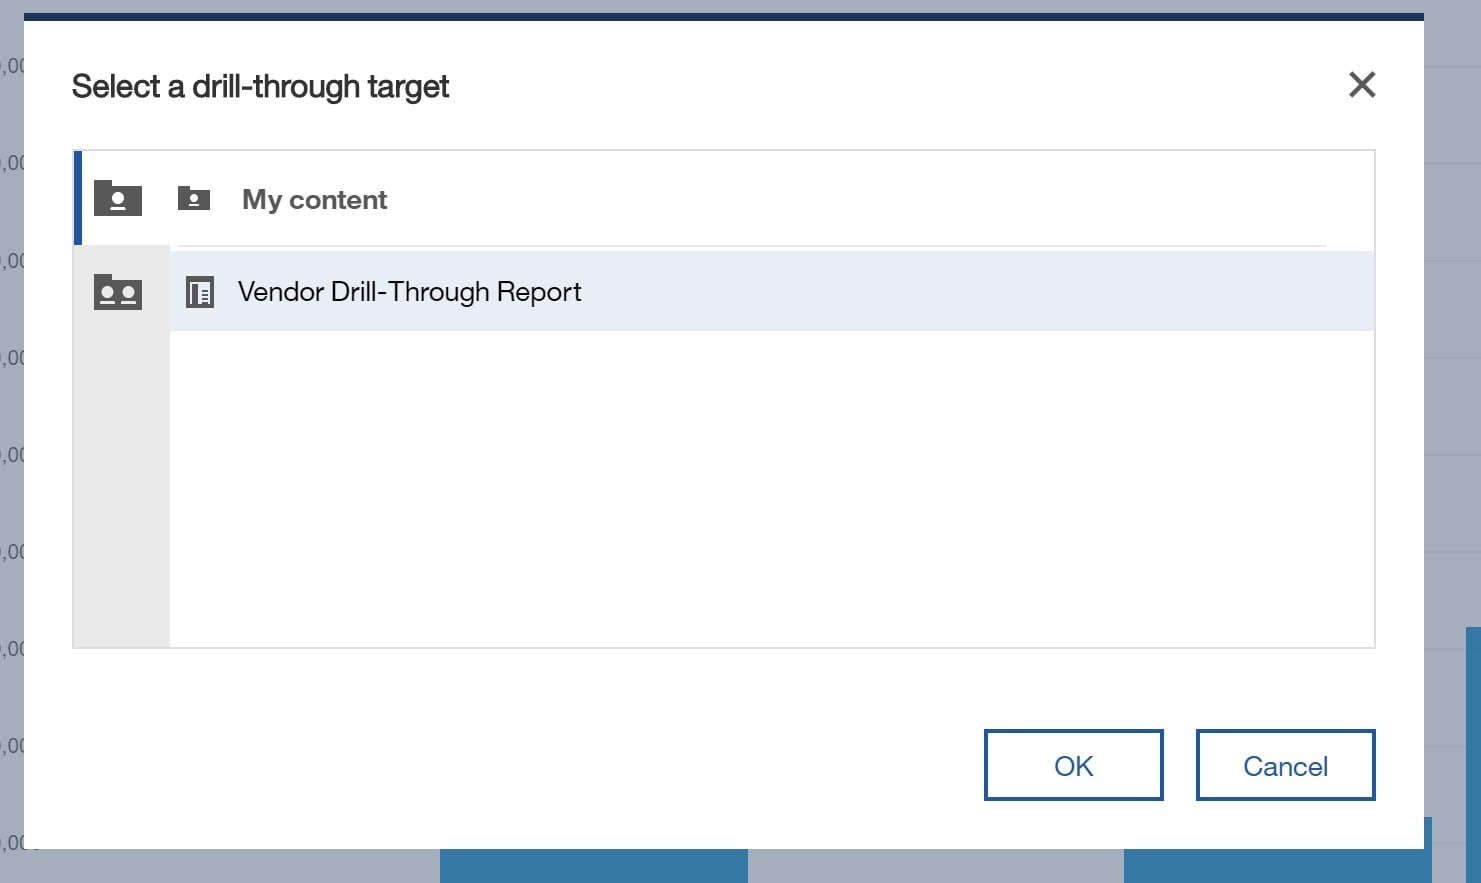
Then, navigate to and select the desired drill-through target report.

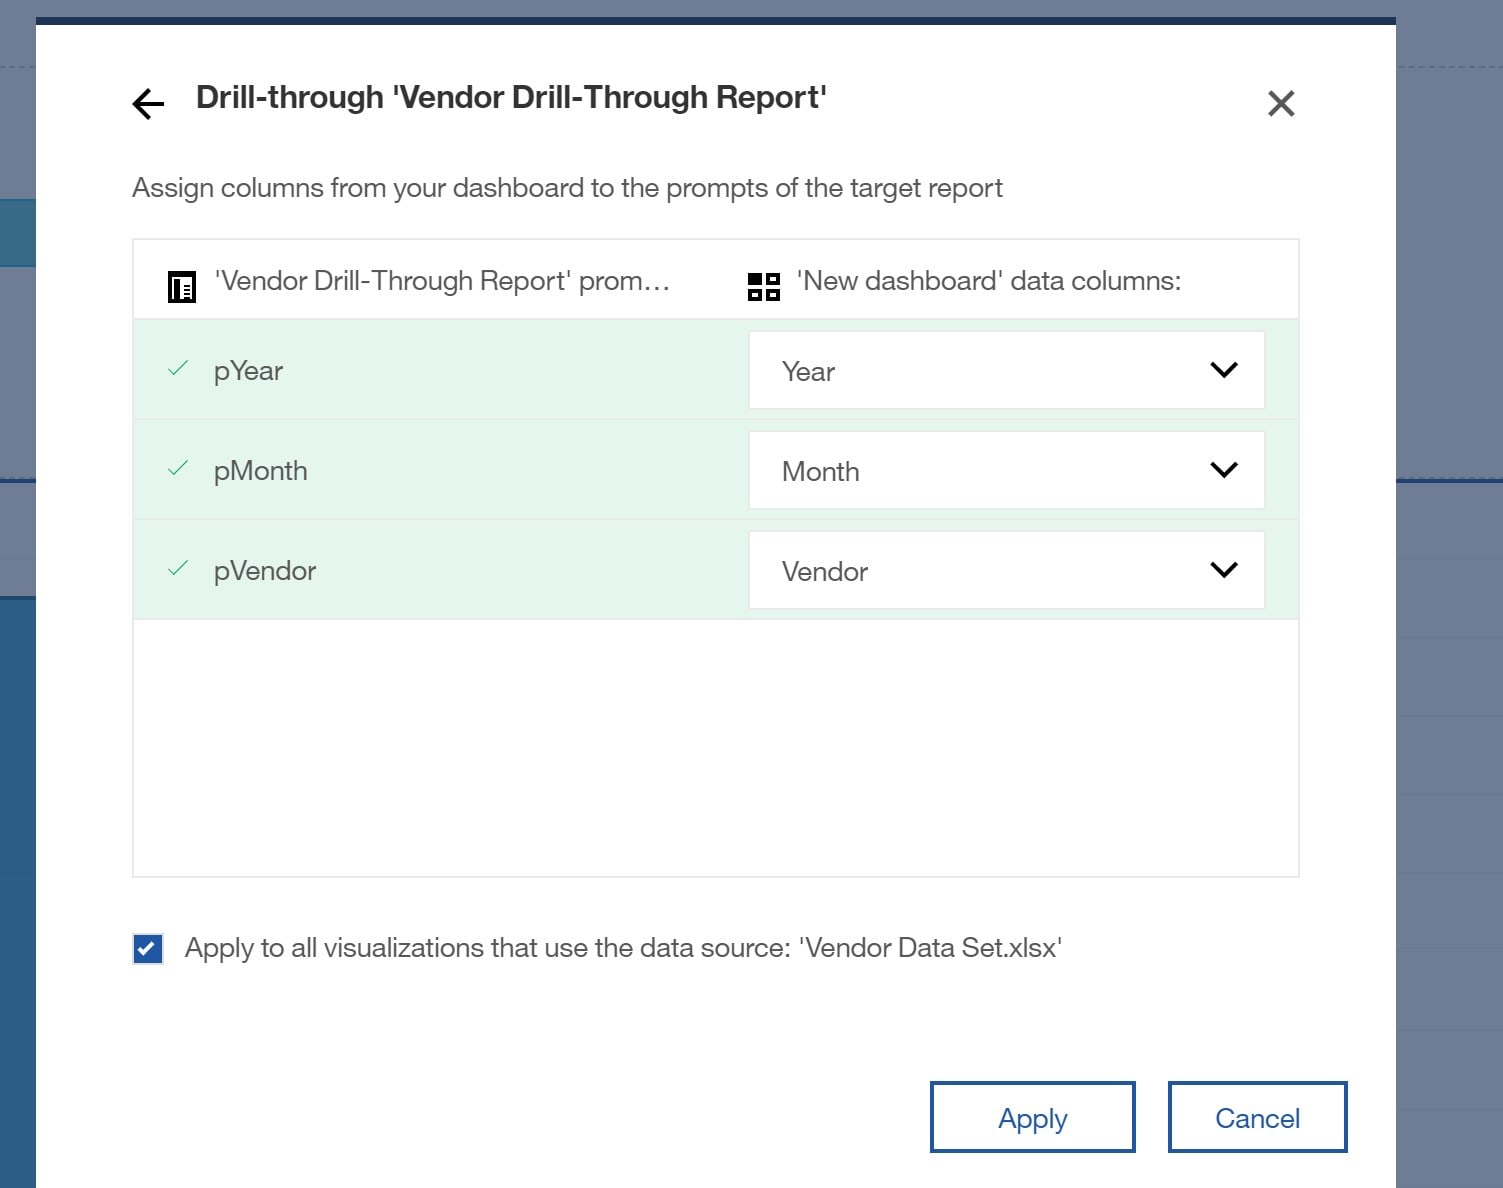
And finally, map the data items from the dashboard to the parameters in the target report.

Selecting the drill-through in a dashboard is accomplished by right-clicking on the desired section of the visualization and selecting the Drill-through icon (![]() ).
).

The Dashboard tool allows users to create high-level, interactive visualizations. However, most consumers of these dashboards require more detailed information. By enabling these consumers to access detailed reports straight from the dashboard tool, rather than from another report, streamlines the creation of and access to information and allows users to produce a coherent story with their enterprise data. Check out our Video to learn more.