I’d like to give a shout-out to Microsoft Excel, the venerable spreadsheet software. If your job description includes reporting, budgeting, planning or forecasting, you rely on Excel to get your job done. Period.
From time to time, something happens and there is an outcry on the dangers of Excel, and some CIO or other will call for it to be banned. There is even a book titled “I Hate Excel”! This leads to planning software vendors making hysterical claims that their solution will “eliminate” Excel from the enterprise.
As a problem solver, computer scientist and finance professional, I find this discourse maddening, saddening and thoroughly unhelpful. Over-simplifying the issue to a “Are you FOR or AGAINST Excel?” discussion, distracts from the real conversation we should be having, namely:
- What is the business problem we are trying to solve?
- What data do we need to solve the problem, and how do we get it?
- Does this problem need to be solved just once, or does it need to be operationalized into a production process?
- Who are the people with the knowledge and/or data, and how do we engage their help to solve the problem?
- Which tools (and yes, Excel is a tool) are best suited for solving this problem?
In this blog post we will discuss:

Excel is Awesome!
Let’s review the process that companies go through, to set goals so they can measure their performance as the example for the rest of this article. This process is most commonly called The Annual Budget, also known as the Financial Plan, or the Rolling Forecast.
For many companies, Excel is the default tool for creating the Annual Budget, and for good reason: it is very powerful. In case you now take Excel for granted, and have forgotten its power, let me remind you:
- You can build a model of your business WITHOUT being a math whiz, a data scientist or a programmer. As a business person, you have a business to run, and not a lot of spare time. For a relatively modest investment of time, you can learn enough Excel to model your business and use the model to help you make important decisions by answering questions like:
- How much do I need to sell to break even and cover my costs?
- How long before I run out of cash?
- Should I build my own, buy or lease?
- It’s an awesome presentation tool for financial and business data: you can format financial and managerial reports just-so, to communicate information effectively.
- It’s a great ad-hoc and flexible data collection tool. Excel is perfect whenever you need to collect data for analysis, but
- you don’t yet know exactly what the data will look like or how it will evolve i.e. your requirements are still fungible;
- you need to do something quickly (in hours or days, not weeks or months);
- you don’t have ready access to a database tool/platform; or,
- you don’t have ready access to database skills.
- It is ubiquitous! Everyone you work with probably has some level of skill with Excel. If you create something in Excel, you can share it easily.
- Excel can be fun! If you like thinking about what drives your business, building models and solving puzzles, you likely enjoy working in Excel. It has a lot of great features to play with, and it provides seamless instant gratification: there is great pleasure in building something, and then seeing it work.
The Problem of Scale
If Excel is so powerful, why does it sometimes get a bad rep? It’s simple: it’s SO GOOD that people don’t realize when they have strayed into areas for which Excel is no longer the best tool for the job. It’s like me and my favorite kitchen knife: sometimes it feels like just too much trouble to take the food processor off the shelf, because I am so comfortable with my knife. The result is that I save 10 minutes unpacking and later putting away the food processor, at a cost of an extra hour of chopping! And I am not a trained chef, so the quality of my chopping is … choppy 😊 The food processor would do a much better job with large volumes of onions than my tired hands and wonderful knife.
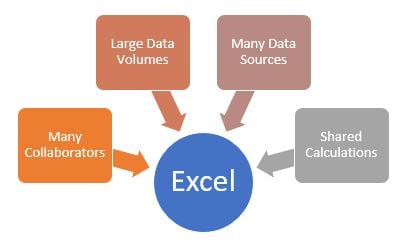
Excel is a bit like my chef’s knife. It is an indispensable tool for an individual, but it simply does not scale well. Furthermore, Excel’s issues with scale pop up in several different ways, as shown here:

Let’s elaborate on this picture using the Annual Budget example.
Many Collaborators
If you own a small business, and you can know everything that is going on, you can build your annual budget on your own in Excel. You do not need collaborators. When your business grows, and you begin to need to delegate, you will want input from other people, in order to ensure your budget is grounded in reality. If you are using Excel, this usually means that copies of Excel workbooks are being passed around in emails. Once this happens, you need to put extra time and effort into coordination, communication and validation. The risk of a mistake goes up exponentially with the number of people involved.
Here's an analogy: suppose you agree to meet one friend in a bar, at the start of a night out. That’s easy to arrange. Think about the additional planning and communication needed to successfully get together with 3 friends, or 10 friends! As you add people, the chances that someone will be late, or go to the wrong bar increases. It is no different when you are preparing an Annual Budget.
Large Data Volumes
Excel can only handle a million rows of data. That’s not much for even a medium sized business. Imagine you have 10 stores who get 100 customer transactions a day. Just 3 years’ worth of sales transaction data gets you to 1 million records.
Many Data Sources
This is related to - but different from – the data volume issue, and likely more pertinent for the Annual Budget. When you begin the annual budget process, you will want to look at historical data to understand where you have been. Your general ledger system will supply financial data by account and department, but may not have the detail you need around product category. That data may reside in a sub-ledger, or a completely different system altogether. To plan your expenses, you will likely want to extract data from a separate HR and payroll system to get it at a detailed employee level. At a larger company that has grown by acquisition, each entity may have different systems, charts of accounts and customer codes. You will need to find a way to combine this data into a single coherent view before you can even begin your Annual Budget.
If you are doing it all in Excel this will be very time consuming and error prone. There may even be disagreements about how data should be mapped, leading to further delays and rework! It is likely that you will be forced to simplify and summarize your requirements, simply because Excel’s limitations will make it impractical to do anything else. This will compromise the accuracy and ultimate utility of your Annual Budget.
Another scenario in the Annual Budget example occurs when budget template spreadsheets are distributed to front line managers for data collection purposes. When these spreadsheets – each a separate data source - are returned, someone needs to combine and aggregate the data. If there are 3 such spreadsheets it is quite manageable. If there are 50, it is more challenging. More time spent combining and aggregating in Excel means less time validating, checking for errors and doing analysis.
Shared Calculations
When you build models in Excel, you will typically create Excel formulas to do calculations. The calculations may be relatively simple like [Units] * [Price], or they can get much more complicated involving a cascading sequence of formulas that reference each other. An example might be a multi-tiered overhead allocation like this:

When calculations are duplicated in many Excel spreadsheets (as is typical) the risk of a mistake increases. Furthermore, it is normal in business for calculations to evolve: for example, what happens if prices change or a new overhead department is added? The calculation needs to be updated everywhere it is used. This too opens up the opportunity to introduce mistakes.
State-of-the-Art Planning
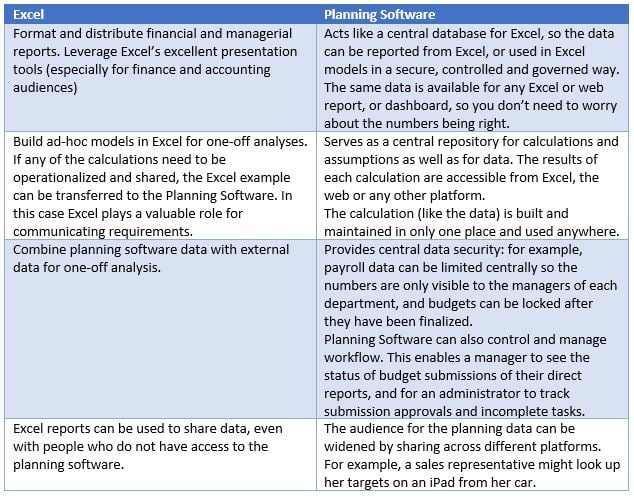
There is a good solution to all these problems. The first step is to understand that awesome as Excel is, it has limitations, and that when you hit those limitations, it is time to take the food processor off the shelf! There are several great planning software solutions out there that are even better than the food processor in the analogy because they leverage and integrate Excel as part of the overall solution.
You could say that they give you a better Excel, as summarized here:

I’ll sum it up this way: combining Excel with the right Planning Software will make your business more agile, more profitable and increase morale in your finance organization as well.
Agility will come from having more time for analysis and being timely in doing it. The sooner you know what is happening in your business, the quicker you can react to it. “Time is money”, after all.
Profitability will improve from having better data at your (and your fellow decision makers’) fingertips, to help you make better decisions. Better decisions will, by definition, make your business more profitable in the long run.
Your finance team will spend less time cutting-and-pasting, and stressing over errors, and more time doing important and interesting analysis, which will increase morale. They will also discover that just as Excel can be fun, the better planning software tools are fun to work with also! They will feel more empowered to add value, and this will result in less turnover of talented people, which in turn will impact both agility and profitability in a virtuous cycle.
The best Planning Software products can do reporting, financial consolidation, allocations, demand forecasting, supply chain planning – and more!
Contact QueBIT at info@quebit.com and ask us about “State-of-the-Art Planning” to find out more!