If you are a long time IBM Planning Analytics (TM1) administrator, you may have developed a fondness through the years for a utility called TM1TOP. TM1TOP would tell you what your TM1 Server was up to, which was especially useful if users called to complain that it was “slow” or “hanging”.
You’d be able to explain (for instance) that it was merely in the middle of a rule save, or a data load, and that they should just be patient for another minute or so. You could even stop processes sometimes, if they were going on too long. Some customers I worked with used to have multiple TM1TOP instances running at the same time – one for each TM1 Server they were responsible for. The user interface was rudimentary - each window looked something like this:

If you are a fan of TM1TOP, I have bad – and GOOD - news for you! The bad news is that IBM Planning Analytics release 2.0.7 will be the final release with support for TM1TOP, and its flashier but less popular cousin TM1 Operations Console (“OpsConsole” for short).
The GOOD news is that both of these have been replaced by the Planning Analytics Administration (PAA) Agent. If you are an On-Premises (PA Local) customer, PAA has been available since Planning Analytics Local release 2.05 (PAW 2.0.39).
IBM’s stated goal is to unify the user interfaces for IBM Planning Analytics over time, ending up with one Excel add-in (Planning Analytics for Excel – or PAx) and one web interface (Planning Analytics Workspace – or PAW) for everything else including administration and development. The PAA Agent brings us closer to that goal. Keep in mind that if you are a legacy PA Local customer, your administrative users are entitled to use PAW (and access PAA) even without purchasing the full PAW upgrade! This topic was covered in our 2018 blog post on planning your upgrade from TM1.
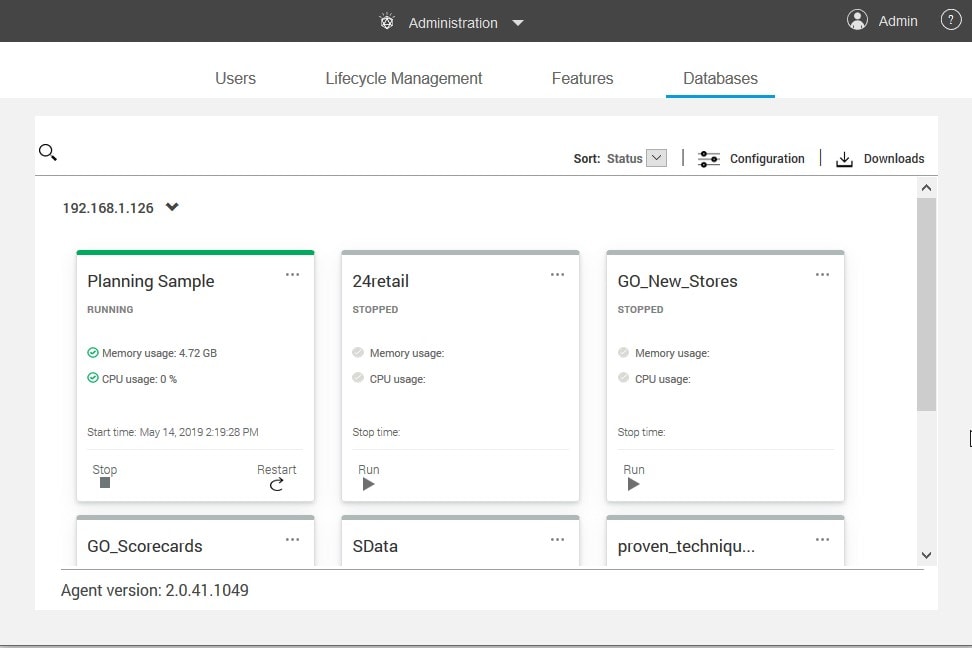
The PAA Agent installs automatically with PAW and is immediately available to any user with administrator rights. It boasts an intuitive user interface displays all available TM1 Servers as tiles on a dashboard:

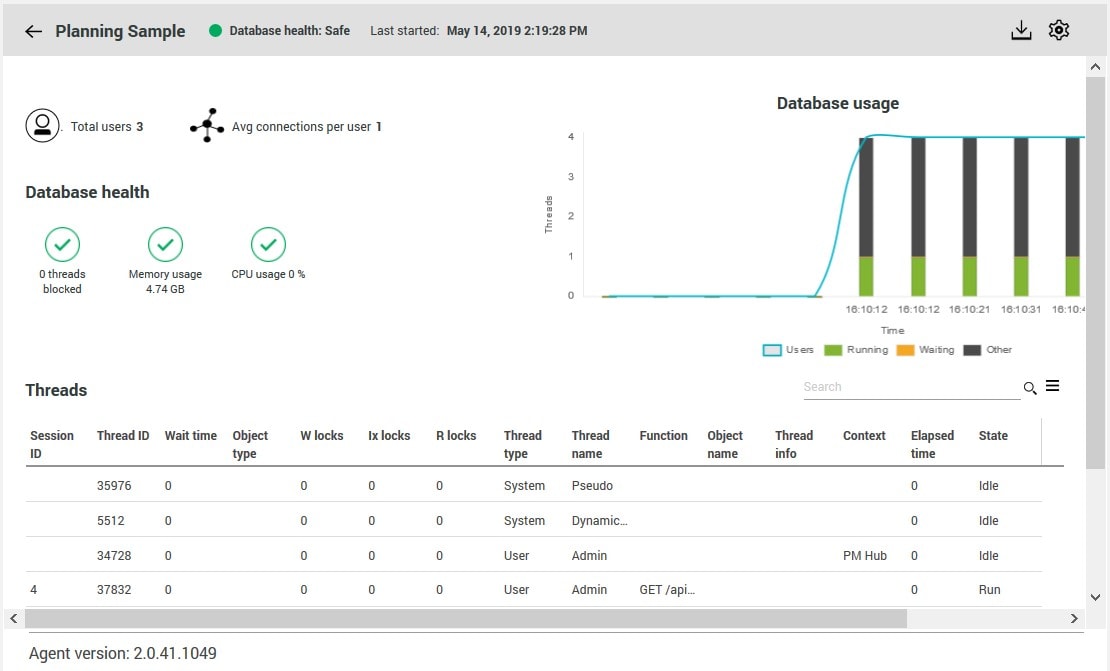
Clicking on a tile opens the Database Activity Report, which provides live monitoring of the TM1 Server, similar to what you are used to from TM1TOP and Ops Console:

So far, PAA has most of the features you would expect including the ability to start and stop server instances, monitor resource usage, update tm1s.cfg file settings and kill all running threads. You can also configure usage thresholds and alerts, for example to send an email when memory usage exceeds a certain threshold!
You can find more information on IBM Planning Analytics Administration (PAA) in the product documentation here.
If you have any questions, or need help finding your way around PAA, please reach out to our Support team at support@quebit.com.