If a picture is worth 1000 words, how many words would it be if you could present your Cognos Analytics data using pictures, and video, and charts, and graphs, and prompts…, all in a guided experience that dynamically, intuitively, and automatically leads your audience through a tailored presentation? I was never that great with math, but I'm guessing it would be a lot of words!!
That's what the new Story templates in Cognos Analytics provide. Think business analytics meets modern-day presentation tools. The IBM Cognos Analytics Story templates have the ability to transform the way you tell your business’ story.
There are two types of Story templates available:
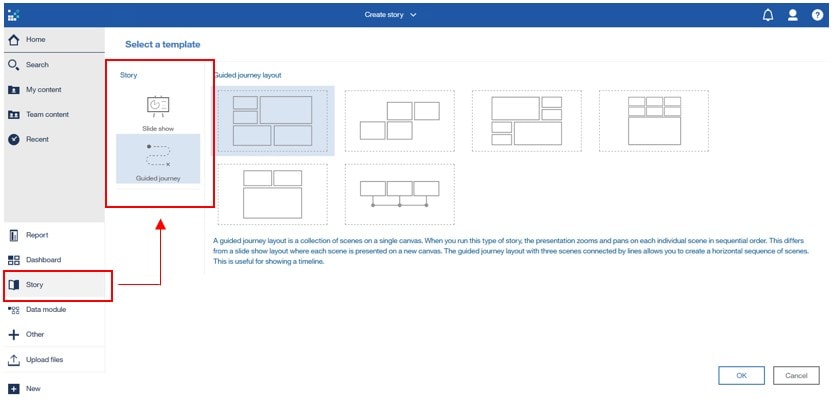 Slide show - similar to a traditional, animated slide deck. Each scene (or slide) in a slide show is created on a single canvas. Developers add widgets (text, image, media, web page) and visualizations (crosstab, chart, graph, etc.) to the canvas and populate them with data items from a data source (e.g. FM package, data module, cube etc.). Scenes are arranged in sequential order. Scenes can have multiple objects on them and can be controlled using the scene timeline and properties pane.
Both template types introduce the idea of a timeline in a Cognos Analytics.
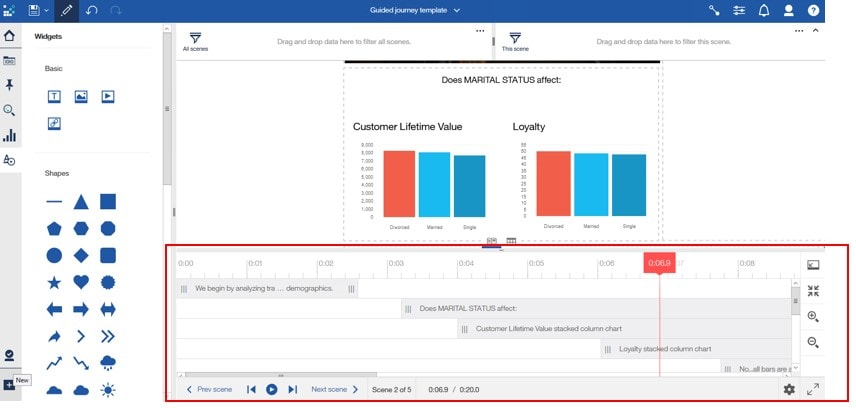
If you're unfamiliar working with slides and content on a timeline, it can take a bit to get your dexterity down, but once comfortable with the workflow story development quickly becomes intuitive and logical.
Guided journey - these templates use built in zoom and pan functionality to move through a collection of scenes on a single canvas, which can be connected to other scenes. This has more the feel a computer-based training module, or guided learning application. A unique feature of this template is the ability to do branched are decision tree style presentations.
Within the context of these two Story template types, developers have access to a wide range of Cognos Analytics' impressive and versatile development functionality, including:
- Sync'd widgets that share common data items
- Drill up and drill down on OLAP or dimensional data
- Add annotations and text to provide context
- Filter data to show summarized or focused slices of the business
- And much more…
This type of "multidimensional" (pun intended), guided analytics development approach and consumer experience is likely to become the norm. It’s just too cool and functional not to. But it is new, so time will tell how businesses tell their story! Check out our latest video "IBM Cognos Analytics Story Templates" on YouTube.